
One of the many aspects I love about Power BI is that you can achieve the same goal in many different ways. This will allow you to choose the path that suits your personal preferences, technical skills or specific restrictions in your project best.
But sometimes exactly this becomes a problem, if the situation and skills allow you to take several paths and you have to decide which one to go. This e.g. might be the case when creating calculated columns in Power BI, SSAS Tabular or Power Pivot.
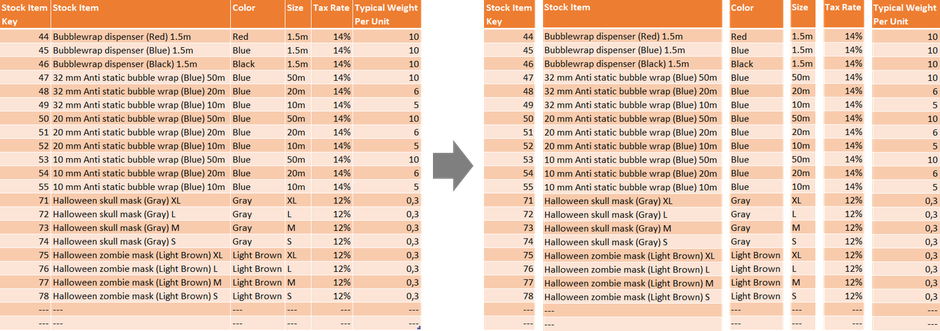
Many roads lead to Rome!
Let's assume you have the following table imported from a SQL Server view in your Power BI, SSAS or Power Pivot data model:
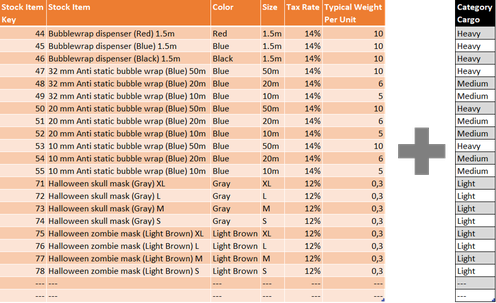
Let's also assume that table contains products in stock and related information such as color, size, tax rates and weight. You want to add a calculated column providing some classifications regarding cargo categories based on the information about weight. You might have several ways to accomplish this at your disposal.
First, you could utilize a little bit of DAX-Code to get the column in place directly in the data model. Second, you could also switch to the Power Query Editor and take advantage of the rich user interface or write a bit of M-Code to change your ETL process and create the recommended column before data is even loaded into the data model. Last but not least you could also log in straight to SQL Server and add the column to the source view using a little bit of SQL. But what to choose when you have all these options?
Let’s consider best performance as the main criteria for our decision. You might have heard about the following rule of thumb:
“Always create calculated columns as close to the data source as possible!”
Maybe you are already following that rule although not exactly knowing why. If that is the case this post will help you out.
Close to data source? Performance? What am I talking about?
Performance is a huge topic in Power BI, SSAS and Power Pivot. It is huge because there are many different areas like visualizations, data model, Power Query, gateways, DAX etc. where it has to be considered from a technical standpoint. But most important performance is huge because it is of fundamental importance for all users. Your dashboard might be beautiful, it might provide great insights, but in the end there might be one piece missing, and as we all know, nobody likes a slow report!
To keep things simple think of performance as the time spent to process data. There are at least two major aspects of processing data in Power BI, SSAS and Power Pivot. The first one is processing data when refreshing your data in the data model. This is the amount of time your model needs to refresh all the tables, hierarchies, relationships etc. to reflect the latest data. Slow performance during that stage often does not directly effect users that much except when refreshing takes so much time that users have to wait in order to perform their analysis.
The second is data processing during query-time. Performance during query-time is strongly bond to user interaction because it is the time needed to scan the tables and perform the calculations each time the user interacts with a slicer or visual.
Adding calculated columns can have impact on both aspects of performance depending on the way you chose to implement it.
The following chart shows a simplified representation of the ETL process of our example:
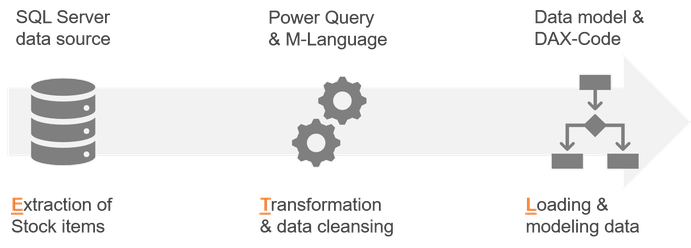
According to the statement of implementing calculated columns as close to the data source as possible our best option, at least from a performance standpoint, is to create the column at data source level in a SQL View. Second best option would be to add it in Power Query during transformation phase while using DAX to create the column would be the last choice. But why is that?
Performance considerations for DAX calculated columns
At first sight it seems very tempting to create the column in the data model using DAX. You may face situations were this is a much faster way to accomplish a task compared to time-consuming adjustments to your databases, data warehouse or the related ETL routines. In addition DAX seems to be an easy way to implement a widely understandable solution because of its syntactical similarity to Excel formulas.
But beware, DAX can be a dangerous beloved, as everyone has certainly experienced who studied this language more intensively. However, from a performance perspective, there is another argument that speaks against this way of implementation and it is tied to the way the VertiPaq engine, the engine behind Power BI, SSAS Tabular and Power Pivot, works.
The VertiPaq engine is a column oriented engine which basically means you have to think of data not stored row wise. Instead tables are devided into their individual columns so data is stored column by column in RAM.
In terms of performance this approach has many advantages compared to the traditional way of storing data row by row. By storing data column by column, queries are able to fetch data more efficiently because they can address just the columns needed in the query result instead of demanding data from all columns even from the unnecessary ones.
In addition storing data column wise enables extensive mechanisms for data compression so data is stored more efficiently leading to more data fitting into RAM. Apart from this, compression also drives faster table-scans during query-time by providing very short tables depending on how good compression worked.
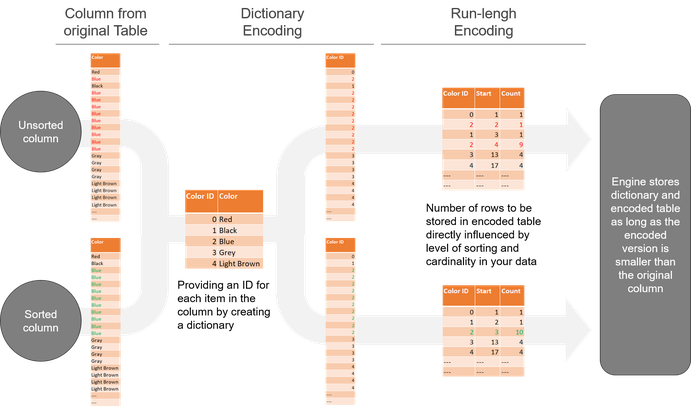
VertiPaq engine performs several complex operations to carry out compression including the most important ones, so called Dictionary Encoding and Run-length Encoding.
The level of compression achieved is related to the grade of Run-length Encoding performed on the data. Run length encoding, in turn is highly related to the sort order of the data. Therefore Power BI, SSAS and Power Pivot perform sort operations on columns during import process. During this operation tables are divided into segments. Segments are read, sorted and compressed one by one to ensure optimal storage of data in RAM.
The process of sorting and compressing is far too complex to be covered in detail in this article. The Power BI community provides a lot of resources about this topics. If you want to know more about data compression and performance in the VertiPac engine just reach out to the web.
But the essential takeaway is that sorting is a key aspect for compression and therefore for performance in Power BI, SSAS and Power Pivot.
Unfortunatelly calcuated columns rely on data from other columns in the data model. Therefore the engine creates calculated columns at the end of import process when all other data already is in place. That’s the reason why calculated columns are not part of the process of finding optimal sort order for compression. That does not mean that calculated columns are not compressed at all, it’s just that they might not be compressed in an optimal way from a performance perspective, like columns are, that are going through the whole import process.
Depending on the amount of data and it’s cardinality this may have a recognizable effect on performance during both refresh and query time.
Performance considerations for custom columns in Power Query
Keeping statements from last section in mind Power BI, SSAS Tabular (beginning from version 2017) and Excel offer the opportunity to create the calculated column as a custom column during the process of importing and transforming data via Power Query.
Although this is an absolutely valid approach you should also consider following aspects when it comes to performance.
Creating additional transformation steps in Power Query to calculate custom columns might also create heavy workload to perform during transformation and may lead to increasing refresh-time.
Whether that’s the case depends on several aspects like e.g. the complexity of the transformation, the amount of data that has to be transformed and the types and number of data sources the data is coming from.
Performing simple operations on a data source that supports query folding and is optimized for performance, e.g. by using indexes, like the SQL Server source in our example, might not cause any issues due to sever side execution of the transformation. On the other hand when you are importing lots of data from Excel, which does not support query folding, the transformation process is performed on client side in Power Query itself and therefore performance can be impacted negatively.
Query Folding is a huge and complex topic on it’s own and it’s detailed discussion is outside the scope of this article. If you want a brief introduction on Query Folding, what it is, when it takes place and by which data sources it is supported I highly recommend reading Matt Allingtons post “How Query Folding Works” or the “Query Folding” section in the Microsoft documentation.
Conclusion
Power BI, SSAS Tabular and Power Pivot offer different ways to perform calculation of custom columns. That in itself is great because it enables you to choose the solution that fits your specific situation best.
However, when you have several ways at your disposal, problems might occur in choosing the right path. That decision might depend on a lot of considerations. In his post “Comparing DAX calculated columns with Power Query computed columns” Marco Russo discusses a lot of technical differences between creating columns in the data model vs. in Power Query and also points out situations in which DAX might be the preferred solution, e.g. if base data for the calculated column coming from different data sources respectively from different tables in the data model.
Nevertheless aspects of performance have to be considered almost all the time. Unfortunately optimizing performance is a very complex task and it is not always clear how some changes and configurations might impact performance in a specific scenario.
In that situation a rule of thumb like “Always create calculated columns as close to the data source as possible!” might come in handy as a first guidance which path to follow.
Considerations from the last sections can help to understand that implementing the column within the data source itself frees you from theoretical discussions about how performance for the end user might be effected. In case it’s not possible, for whatever reason, to implement the calculation at that stage, Power Query is a good fallback scenario still ensuring that the column created will be recognized in the sort operation of the VertiPaq engine resulting in optimal compression and performance. Following that rule, an implementation via DAX will only be the tool of choice, when the other ways are no option at all for instance in situations that Marco describes.
I hope you enjoyed this post and will also be here for my next contribution. You can also visit me on my YouTube-Channel for more content on Power BI, SSAS, Power Pivot, Power Query, DAX und M!


RELATED TRAININGS...


STAY IN TOUCH...
Kommentar schreiben