
Missing data is a topic that has received unsufficient attention. All demos, posts and examples normally suppress the fact that in many projects data is likely to be incomplete. There are various reasons for this. In real world missing data is everywhere and significantly influences the quality of your analysis. That is why handling missing data is so important.
If you are new to using R in Power BI I recommend reading the first part of this series. It will get you started with all the necessary technical details so you can follow along:
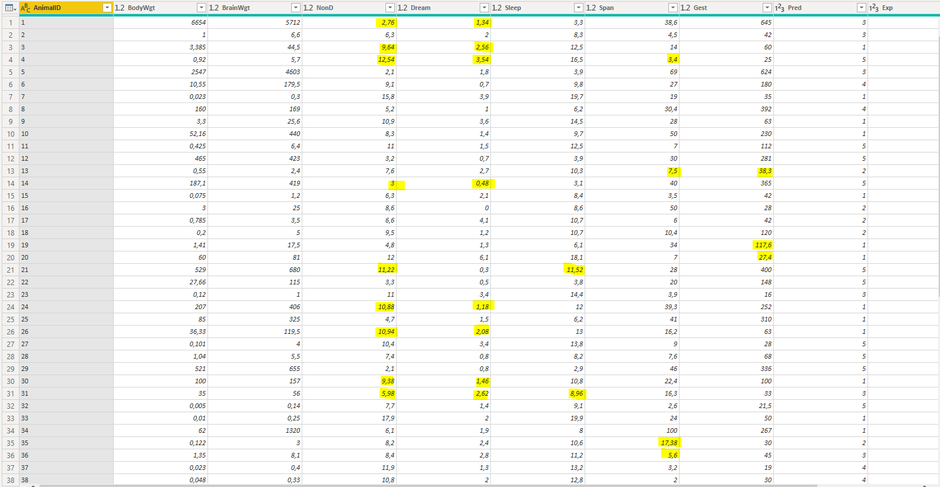
As sample data I am using the mammal sleep dataset ("sleep") which comes with the "VIM" (Visualization and Imputation of Missing Values) package of R and deals with the sleeping habits of several animals. It contains data of 62 animals, some of their attributes (e.g. body weight, brain weight, how dangerous they are) and some scores on their sleep habits (e.g. length of sleep, length of dream phase).
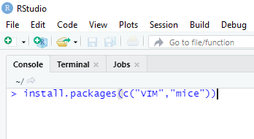
Later on we will use the "MICE" (Mulitvariate Imputation via Chained Equations) package of R to handle missing values. So if it is not already the case, use the install.packages() command of R to install both packages on your local machine as shown in the screenshot to the right.
Identifying missing data in Power BI
The first step in handling missing data is identifying it and reasoning why data might be missing.
To load the "sleep" dataset to Power BI you can use the R datasource in the "Get data" experience (Power Query) of Power BI Desktop and follow these steps:
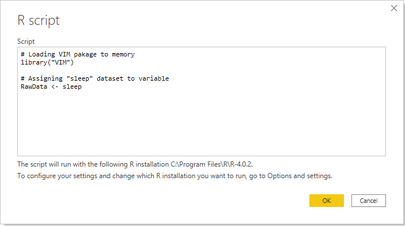
- Select "R script" as datasource in Power BI Desktop
- Use library() command to load "VIM" package into memory
- Assigning "sleep" dataset to a variable (in this case "RawData")
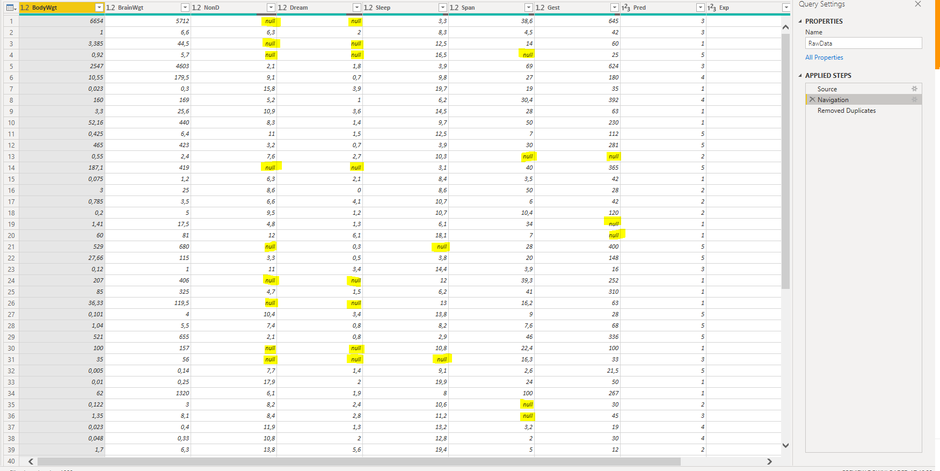
- Click OK and select the dataset labled "RawData" in the Navigator window
- Open the Power Query Editor window by clicking "Transform Data" to have a look at the dataset
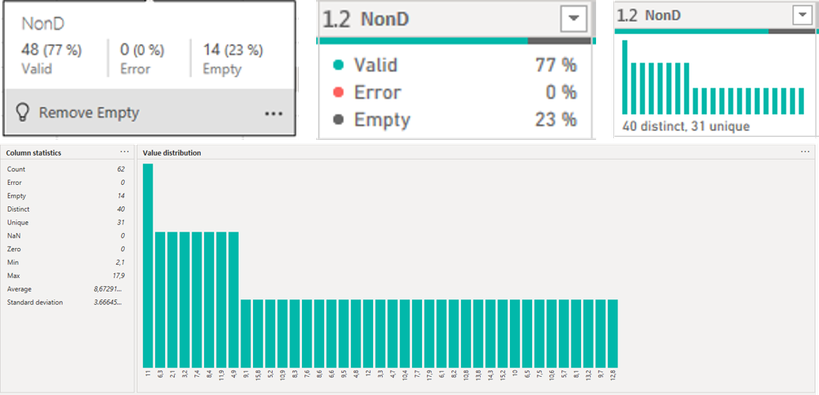
The best way to identify missing data patterns in your dataset is to visualize it in a tabular or graphical way. It turns out that there are some missing values spread accross several columns in the sleep dataset. Lets have a brief look:
Power BI Desktop offers a solid set of features to get an impression of the quality of your data within the Power Query Editor window.
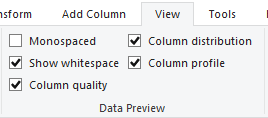
Features like "Column quality", "Column distribution" or "Column profile" can be enabled in the "Data Preview" section of the View-tab. They give you some information on valid values, error values, blank data and their distribution and percentages within each column of your dataset. This way you can get a fast impression on how the quality level of your dataset is and whether missing values really are an issue to be dealt with before loading the data to your data model for further analysis. Unfortunately these features (at the time of writing) do not include any information on how missing data is distributed along the attributes of other columns.
They do not give any information on correlations of data missing in specific categories or groups. This would be useful to understand whether missing data is concentrated in specific areas or spread all over the whole dataset.
But why would that be helpful? Missing data can be classified in one of the following three types:
- Data missing completely at random (MCAR): The presence of missing values in a column is not related to attributes of other columns in any form. There is no systematic reason for their missingness.
- Data missing at random (MAR): Data is missing at random when missingness is related to attributes in other columns but unrelated to attributes in the same column. For example there might be more values for "length of dream sleep" missing for animals with lower body weight but the missingness of the values is not related to the time an animal is dreaming.
- Data not missing at random (NMAR): The data that it is missing is related to specific attributes of other and/or the same column.
Visualising correlations and patterns of missing values in your dataset would be of great help to understand why data might be missing and classify of which of these three types it is.
Understanding whether data is missing at random or not is crucial to figure out the right approach to handle missing data. Fortunately R is capable of showing such correlations using functions from the VIM package. Those features are outside the scope of this post. (Read more on this)
The obvious approach of handling missing data
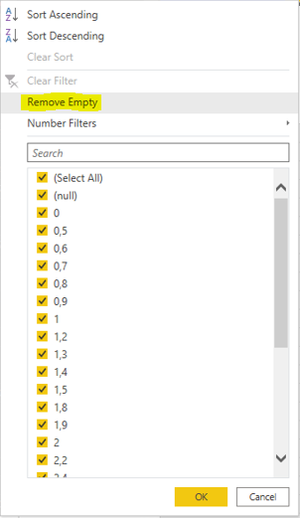
In its simplest form handling missing data can be done by deleting it. This can either mean deleting all rows containing any blank values (so called listwise deletion) or by excluding all rows that have missing values in columns of special interest for your analysis (so called pairwise deletion). Both can simply be done by filtering your dataset in the Power Query Editor window.
A radical approach like this only is suitable if there is not to much data missing or missing values are concentrated within small groups of the dataset. Otherwise your data might loose any analytical meaning. In our case performing listwise deletion on the "Mammal sleep" dataset leads to reduction of rows by nearly 50%. Keep in mind that the original dataset itself only contains 62 rows which limits the analytical power of that dataset anyway. But the example shows that deletion might damage your data to an undesireable extend.
Another obvious solution might be filling up blanks by simple imputation of dummy data or calculated values. This can be achieved by filling up blanks with averages, medians or any other value derived from calculation.
In some cases a rational approach might also provide help by mathematically deriving missing values based on items in other columns. An example would be calculating missing travel distance in a dataset based on existing information about travel speed and travel time, which could simply be done within custom columns in the Power Query Editor. Unfortunately this is not an valid option for our sample dataset.
Except for the mathematical approach, it is fair to say that it is not recommended to use approaches of deleting or simple forms of injecting data.
But what other solutions are available, in case none of those options turn out to be sufficient?
How R can help you solving the problem!
What if you face a complex scenario of missing data? R provides a wide range of functionality for handling missing data scenarios. Although there are several packages dealing with this topic we will focus on the "MICE" package to solve our data quality problems. The "MICE" package can be used to solve MAR-data problems only. Estimation of missing values is done based on repeated simulation (multiple imputation) and statistical methods. Missing values in each individual column are estimated based on values in all other columns until all values in all columns are estimated.
In order to use the "MICE" package to fill up missing data follow these steps:
- If it is not already the case install "MICE" package on your machine using the install.packages("mice") command
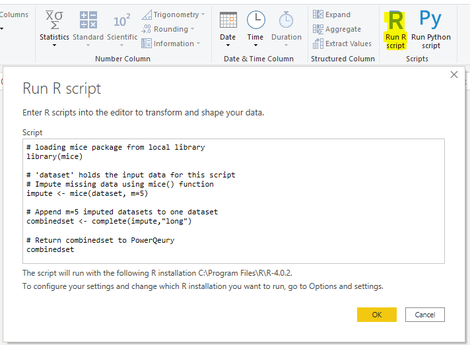
- In the "RawData" query from prior section go to the "Transform" tab in the Power Query Editor and add a step by klicking "Run R Script" as highlighted to the left.
- Load "MICE" package into memory using the library() command as shown in the screenshot
- Inject estimated data to the dataset using the mice() function. This applies statistical models to the m=5 separated datasets that mice() creates.
- Append all m=5 versions of imputed datasets to one dataset using the complete() function
- Return the dataset to Power Query
Although we did not configure them in our example the mice() function provides a lot of parameters, most of which are optional. Some of the most important are:
- data: The dataset with missing data, you want to do the imputation on.
- m: The number of imputed datasets. The default is five which means five copies of the dataset are created to perform the imputation.
- method: Can be used to specify the imputation method to be used for each column in the dataset. The default imputation method (when no argument is specified) depends on the defaultMethod parameter.
- where: Enables skipping of imputation for selected missing values
- defaultMethod: Specifies the statistical method used for imputation. If left empty the default method used is "PPM": predictive mean matching. Some other methods available are "logreg" (logistic regression), "ployreg" (polytomour regression) or "polr" for proportional odds model.
- maxit: The number of iterations performed for imputing the data. The default is five while more iterations tend to provide better results for the estimated data.
In order to learn more about the "MICE" package reach out to the documentation in the CRAN repository.
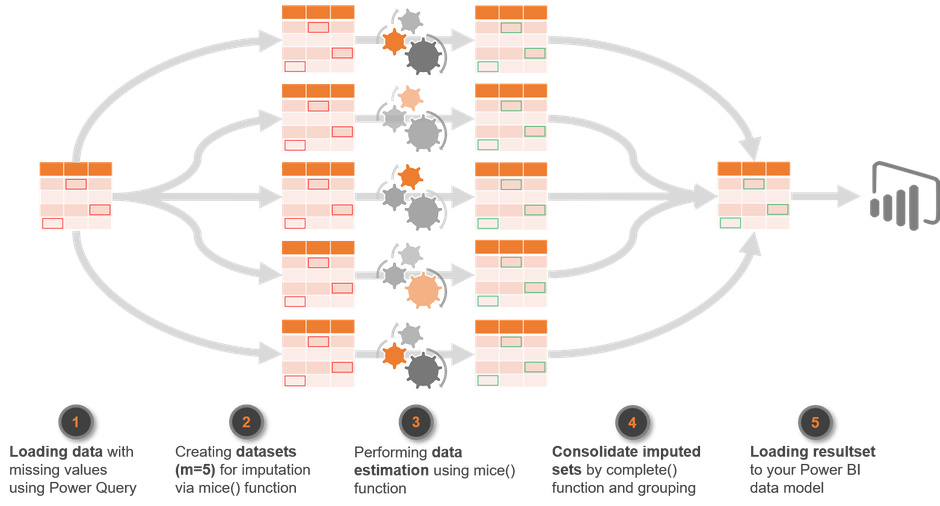
Afterwards the completed dataset can be grouped and summarized (e.g. average, median) to get one final dataset out of the five imputed copies to load into your data model. The picture below wraps up what happened to the original data:
The picture below shows the resulting dataset with the estimated values that were imputed by the mice() function:
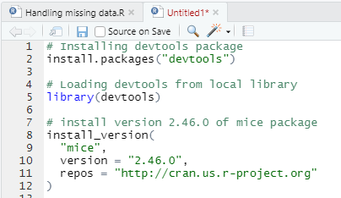
Please be also aware that, at the time of writing, the Power BI Service only supports "MICE" package 2.46.0 (Link to current supported packages).
While the install.packages() command downloads the most recent version of packages from CRAN repository, R also offers a way to ensure that the respective version supported by the Power BI Service is installed on your machine for development purposes. This is done by using the install_version() command from the "devtools" package as shown in the picture to the right.
Be also aware that usage of R language currently is restricted to the use of the Power BI on premises data gateway in personal mode. The on premises data gateway in standard mode (aka Enterprise data gateway) currently does not support R.
Feel free to download the sample file I used for this post right here:
What have we learned?
Datasets are more often incomplete in reality than we would all like. Having high quality in your data is fundamental to deliver meaningful analysis. Although ensuring data quality at ealier stages of the process should always be the prefered option sometimes there is no other choice but to handle data quality issues while data is on its way into your model.
Power BI itself offers some solid features to identify missing data and also to perform basic approaches for handling it. Unfortunately the simplicity of those solutions might not be enough. That is where R can add some value to the process by providing statistical methods to deal with even complex scenarios of missing data and increase data quality.
I hope you enjoyed this article and will be back for the third part of the series. You can also visit my YouTube-Channel for more content on Power BI, SSAS, Power Pivot, Power Query, DAX und M!


STAY IN TOUCH...
LATEST ARTICLES ON BI BLOG...
>> mehr lesen
DevOps for Power BI - What is it? Do you need it? And which options are available? (Fri, 26 Nov 2021)
>> mehr lesen
Kommentar schreiben