
Complex decisions are constantly being taken within organizations, with increasing frequency. Often these decisions rely on data.
Organizations that still bet solely on the classic approach of centralized Corporate BI often struggle supporting decisions due to long delivery times of their BI solutions and a lack of balance between IT knowledge and business knowledge introduced into the solution. This leads to a situation in which decision-relevant information is not available in time, the provided solution does not cover the needs of the departments perfectly and confusing, error-prone Excel landscapes arise to kinda solve this problem. This post is about a way to overcome this situation.
There are always more good ideas than capacity to implement!
The problem for organizations heavily relying on a centralized Corporate BI approach is often simple. Lack of capacity. Unfortunatelly central BI normaly does not have to choose between good ideas and bad ideas to implement. That would be easy. In most cases there are a lot of good ideas and, in respect to the available capacities, decision goes between good ideas and good ideas.
Even if there are specialized rapid response teams within the central BI department, to respond to urgent requests, they may already be blocked due to the number of important requests. In addition, it often turns out that, although experts from business departments are usually involved in the development process, the result does not perfectly meet their needs. Centralized BI departments typically provide BI developers, primarily highly skilled technical experts who will never know the business processes or the meaning of business data as well as a business expert. This increases the potential risk of misunderstandings and thus of incomplete solutions.
In this situation business departments tend to turn to the quick fixes they know best: Homegrown Excel solutions with all their great aspects of speed, flexibility, great features and endless possibilities. But also with all its drawbacks like heavily manual work, inconsistent versions of the truth, lack of data governance and security, and error-prone Excel landscapes with dozens and dozens of files floating around.
Don't get me wrong, I love Excel. All these negative aspects are not Excel's fault. Excel solves a lot of problems. Isn't that what software is about? And Excel is a hell of a problem solver. So it works, some how, for some time.
But it's all about finding the right time to jump to a more robust solution, because not everything you can do with a tool should be done. The question is how to solve these problems without inflating the central BI department with personnel? How can you accelerate BI deployment, leverage as much business knowledge as possible, while gaining more control over what happens to your data within the organization?
Widen the BI bandwidth within your organization!
In order to change this, organizations will have to change the way they think and live BI. They need to shift their perspective to a broader picture of Business Intelligence, expanding from pure Corporate BI focus to a comprehensive approach, including aspects of Managed Self-Service BI and Self-Service BI.
The key is to decide which topics are delivered via which area within that BI bandwidth. The better this distribution succeeds, the better the results will be in terms of delivery time, manageability of the BI infrastructure and a good balance between technical and business knowledge introduced into the solution. People delivering solutions within the Corporate BI area are generally characterized by very good technical but less pronounced business knowledge, while people creating Self-Service solutions need a strong business understanding to create very specific, but often smaller and simpler analytical tools.
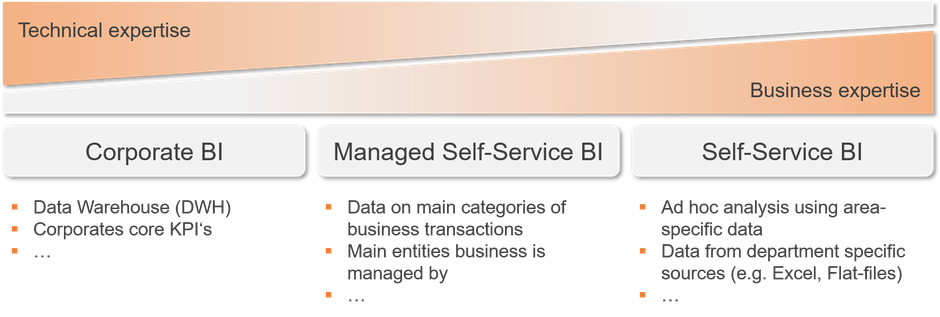
Considering that, Corporate BI includes all structures organizations have known for decades. A central department with experts in data transformation, -management, - modelling and reporting, which takes up the requirements from the business departments and delivers BI solutions that comply with corporate rules for design, governance and security. There was and is a clear need for this type of structure. The famous "single point of truth", e.g. in the form of developing the organizations data warehouse, but also specific analytical needs, such as providing the fundamental core KPIs, are well catered here. These KPIs are relatively stable over time and form the guiding metrics according to which the organization is managed, often targeting higher management levels.
Managed Self-Service BI is an area where business departments use quality-assured components and artefacts, still developed by central BI, but combined by business departments themselves to create the solution required. These artefacts often deal with the cornerstones of data in the organization. Data that will always be used to manage the business although the measurements and KPIs derived and the way these KPIs are visualized may change over time. These artefacts might be delivered through the data warehouse, OLAP databases or other features that the organizations BI tools are capable of.
Self-Service BI comes into play when dealing with ad hoc requests or niche solutions that only serve a very small part of the organzation. However, this does not mean that business departments are left to their own within this area. But support provided by central BI department is limited to consulting in technical questions or granting access to datasources rather than being heavily involved in the development process. Data is often only extracted from .CSV or Excel files that originate from departmental systems or that are already maintained in the business department. These solutions do not need to address all aspects of design, governance and security. Speed and in-depth knowledge of specific business requirements are the key benefits. Although this may sound a bit like the Excel landscape I described at the beginning, in this case, the goal is to ensure at least a minimum level of compatibility and integration into the official BI infrastructure for these solutions in order to take advantage of Self-Service BI and minimize the negative aspects.
Sometimes these solutions become so useful to some executives that they expand over time in terms of functionality and complexity. Therefore, there may come a time when it makes sense to move this solution out of the self-service area and into the responsibility of central BI.
Choose the right tool for the job!
But what is the best strategy worth if it is not actionable? What good is it if you simply do not have the tools to support all these areas of BI adequately? So the choice of tool is crucial for success and even if there are a lot of great tools that could do the job, Microsoft Power BI is always worth considering with its broad feature set spanning the entire business intelligence development cycle, its great "value for money"-ratio and excel-like user experience.
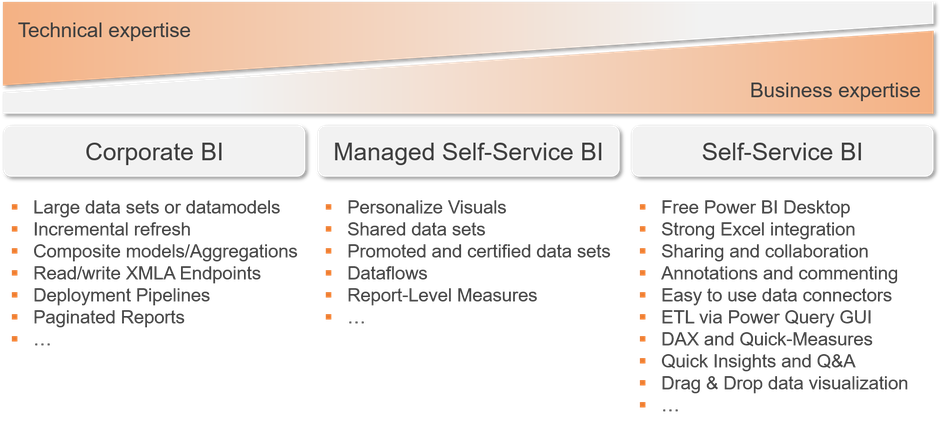
Power BI is able to support Corporate BI scenarios offering a lot of useful features for large enterprise solutions. Incremental refresh, the ability to handle large datamodels or Aggregations and Composite Models for analysis on massive data sets are just some examples. XMLA Endpoints enable model authoring with a wide range of tried and trusted tools like SQL Server Management Studio, DAX Studio, Tabular Editor, Visual Studio or ALM Toolkit, while Deployment Pipelines support version control and rollout. Integration of good old Paginated Reports can make Power BI the one-stop shop for all your reporting needs.
But Power BI also supports Managed Self-Service BI scenarios enabling business users to leverage pre-built and quality- assured reporting artefacts on which to build their own solutions. For example, Personalize Visuals offer an easy way to change the content of an existing report by changing the measures displayed or the type of visualization itself. Shared data sets, which can also be promoted and certified, provide a ready-made datamodel which might already contain some measures but also allows users to build their own calculations on top of it and design complete dashboards and reports. With dataflows, Power BI even goes one step further. With this feature central BI provides pre-built tables or entities that users can combine to build their own models and reports.
Last but not least, Power BI has a strong self-service DNA and underlines this with a whole range of features. Just a few examples are the free Power BI Desktop, strong Excel integration, extensive sharing, commenting and collaboration features, numerous out-of-the-box data connectors, easy-to-use data transformation via the Power Query GUI, the Excel formula like DAX language, Quick Measures or Quick Insides and the ability to create natural language queries using Q&A.
Prepare the people for the job!
Even though Power BI is a Self-Service BI tool, that doesn't mean that people are able to do anything they want to do when they open it the first time. Although the hurdles have been lowered significantly compared to legacy tools, Power BI also requires investment in people to get the most out of its capabilities.
For this BI approach to be a success, there must be people who fill certain roles in your organization. The categories listed below are not exhaustive. Depending on the size of the organization, the role concept may be more or less detailed. Depending on the size, there may also be several roles that are performed by one person, or a role that is performed by several people. Therefore, the categorization mentioned below is nothing more than a rough grouping of skills that I think should be present in the organization.
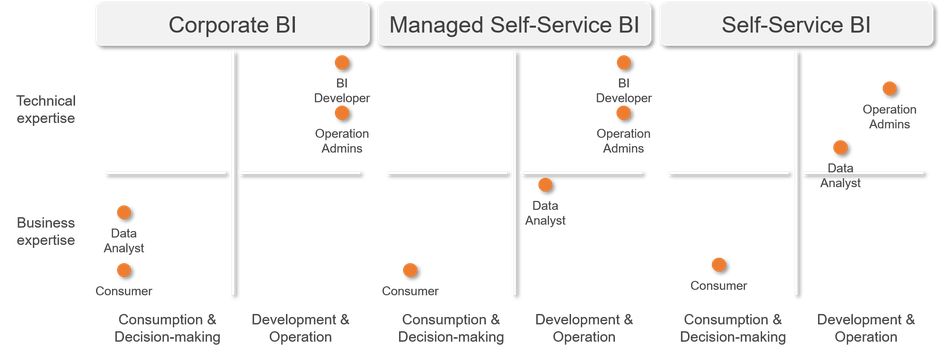
Consumers are people who use pre-built reports and dashboards created by people from other roles to support their decision making. To empower this group of people, basic training for the Power BI Service is required. This may include for example:
- Logging on to the Power BI Service
- Navigating, filtering and interacting within dashboards and reports
- Using Quick Insights and Q&A
- Using Personal Bookmarks
- Managing data alerts and report subscriptions
Although consumers are normally only expected to consume content, training requirements may go all the way up to the first basic report authoring capabilities e.g. the usage of Personalize Visuals.
The requirements for Data Analysts are based on those of consumers, but go much deeper in terms of authoring skills. Data Analysts are kind of power users within the business department. They not only consume content created by others, but also edit reports and dashboards or even create their own reports based on pre-built datamodels or dataflows. To do this, the Data Analyst should be trained in the following additional areas:
- Loading and merging data sources
- Data wrangling and shaping using the Power Query GUI
- Publishing and sharing reports and dashboards
- Basic data modelling technics
- Intermediate knowledge of the DAX-language
- Advanced visualization knowledge
Depending on the environment and the extent to which the Data Analyst performs Self-Service BI and creates BI artefacts from scratch, the training should be extended to advanced data modelling and advanced DAX programming. Programming skills in Power Query using the M language may also be required.
The BI Developer is located within the central BI department and creates governed enterprise content, complex models, reports and Power BI apps, and handles small and complex bugs. He is capable of handling and blending the various data sources within the organization and integrates them into the existing BI environment. He manages data refresh or real time data. Therefore, in addition to the Data Analysts training, curriculum includes:
- All aspects of Power BI and it's related products used in the organization. This may include Power BI Service, Desktop, Mobile App, Report Server, DAX Studio, Tabular Editor, ALM Toolkit and others
- Advanced ETL capabilities in M and Power Query
- Advanced data modelling
- Advanced DAX programming skills
- Advanced knowledge in data visualization and dashboard design
- Knowledge of data gateway configuration
- Knowledge of licensing related features in Power BI Pro and Premium
Required training might also include programming skills in R or Python, or necessary skills for Power BI Embedded or Custom Visuals, if used within the organization.
The Operation Admin is the guardian of data, processes and policies in all areas of the BI approach. He manages premium and embedded capacity, ensures compliance, enables key features by managing the tenant settings, performs auditing and monitoring, is responsible for acquiring and assigning licenses, manages resources and provides help and support.
Examples for required training are:
- Reasonable parts of the Data Analysts training content to ensure Admins know what they administrate
- Features of the Power BI Admin Portal, Azure Active Directory, Microsoft 365 Admin Center
- Auditing and monitoring capabilities
- Usage of PowerShell and Power BI REST API to automate administrative tasks
- Management and monitoring of the data gateway
Conclusion
When organizations face a situation where the capacity of the central BI department turns out to be the bottleneck in BI delivery and understanding of business requirements is not ensured to the greatest extent possible, a change in the way BI is viewed may be the solution. This includes extending the classic approach of purely centralized BI delivery and incorporating different degrees of the concept of Self-Service BI. To be successful in this change, two important factors, among others, must be considered.
The first is to take people on the road by assigning them specific responsibilities and roles, while providing them with appropriate education and training.
The second key aspect is to choose a tool that is able to support each area of BI and people in their specific roles. Microsoft Power BI can do this and has a number of good arguments to consider when making the tool decision.
I hope you enjoyed this article. You can also visit my YouTube-Channel for more content on Power BI, SSAS, Power Pivot, Power Query, DAX und M!


STAY IN TOUCH...
LATEST ARTICLES ON BI BLOG...
Kommentar schreiben